


Pathology
This section presents slides from a wide range of pathological conditions, classified according to their acute, chronic or reactive nature. Where available, the corresponding XN scatterplots and the immunophenotype of the aberrant cell population are also shown. For each slide, a bar graph is displayed that provides insight into the different cell types and their ratios.
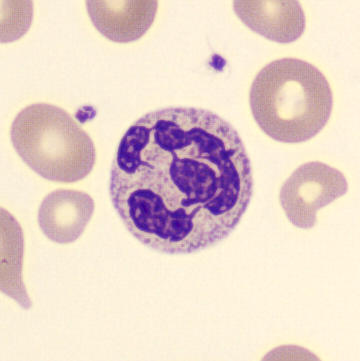
Neutrophils
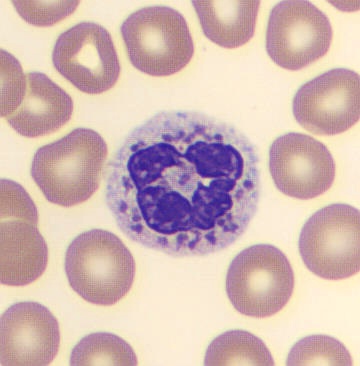
Eosinophils
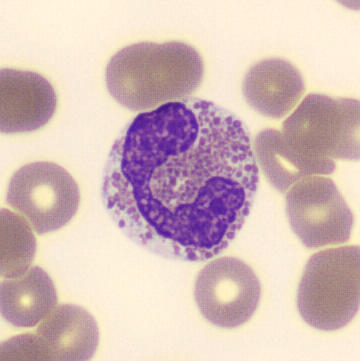
Basophils
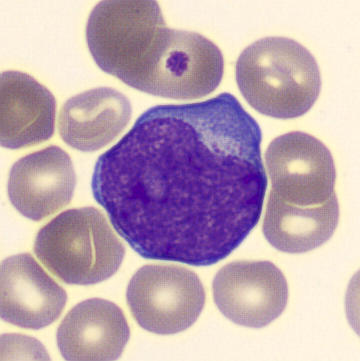
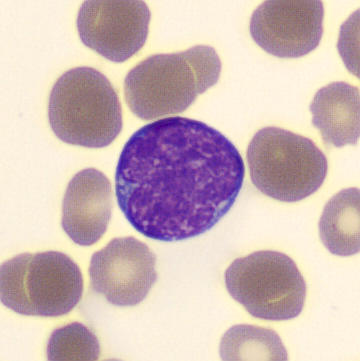
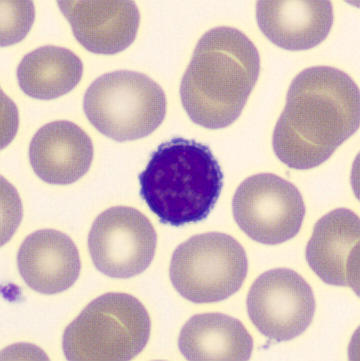
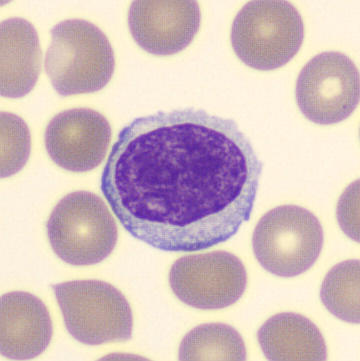
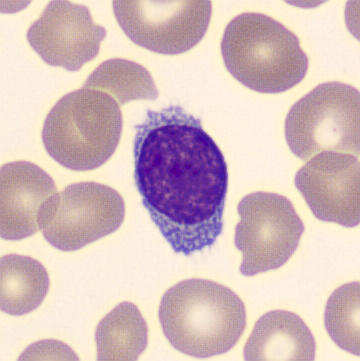
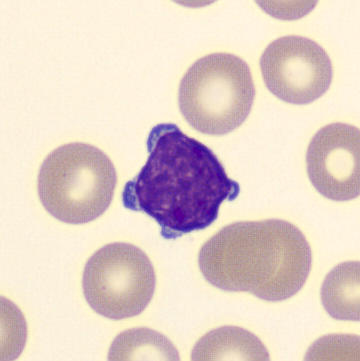
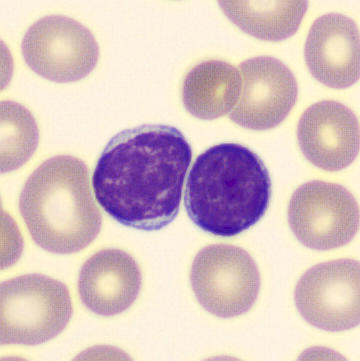
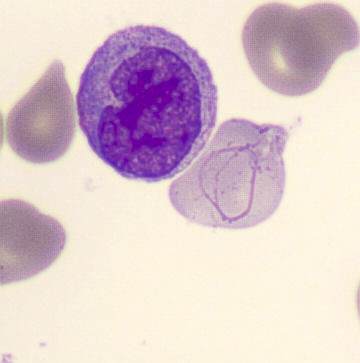
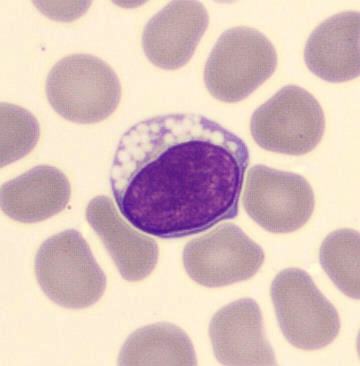
Lymphocytes
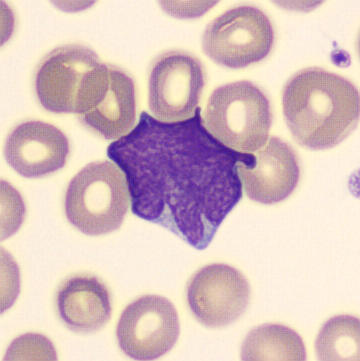
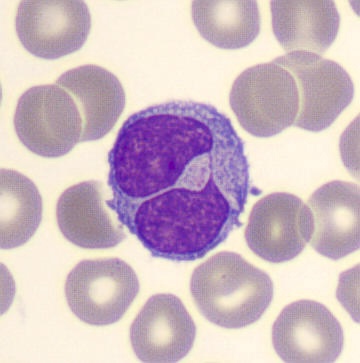
Monocytes
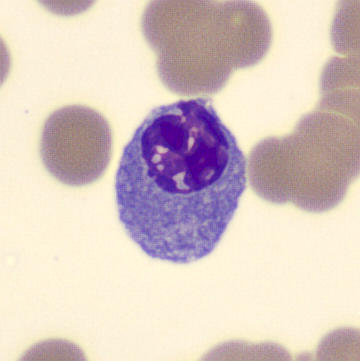
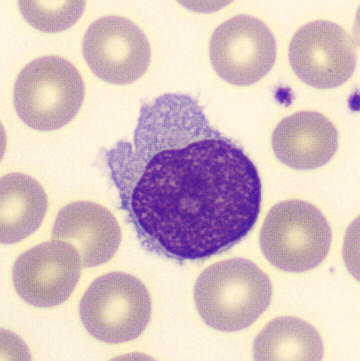
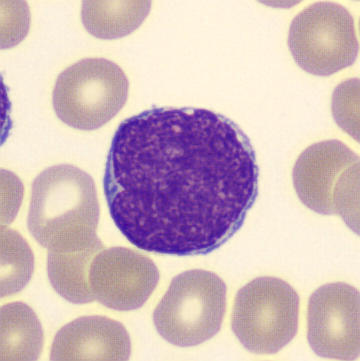
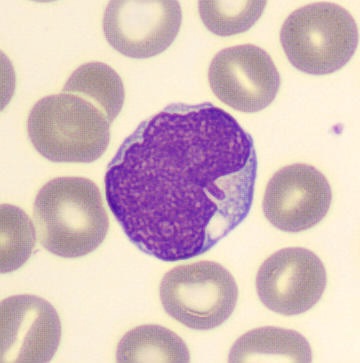
For clarity, only the most notable or aberrant cells are shown. These cells are marked blue in the bar graph. The example above shows an approximate normal ratio of leukocytes of an adult.
Availability
Where possible, slides from peripheral blood (PB) are complemented by images from bone marrow (BM, aspirate squash preparation) and immunophenotyping (IFT) scatterplots. The unavailability of material may be because there was no indication for a bone marrow puncture, because of a dry-tap or because the diagnostics were done in a non-participating centre.


