Scattergrams
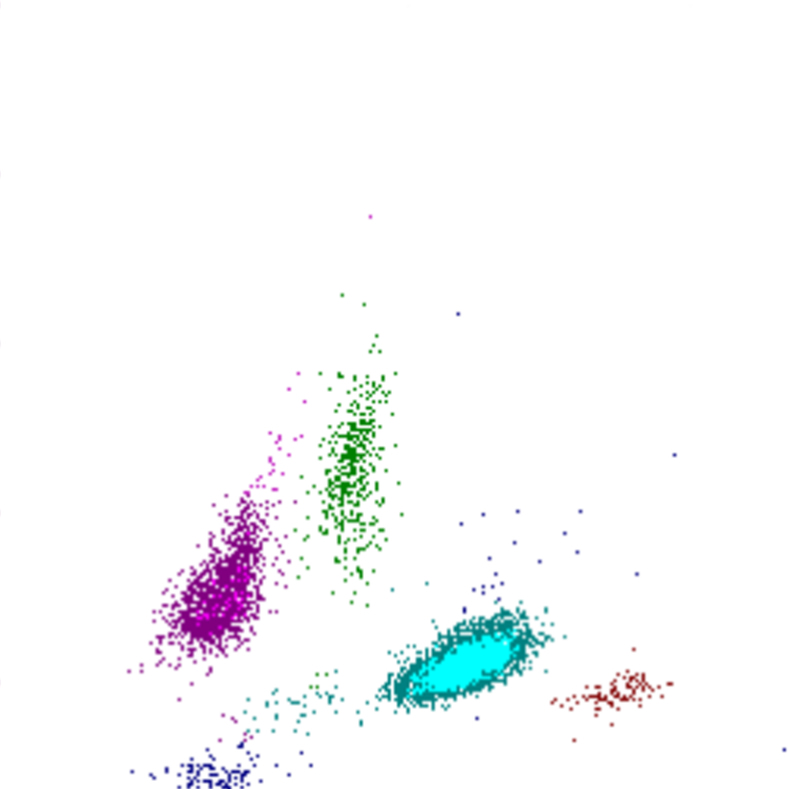
In this section, you will find an explanation of scattergrams (also referred to as scatter or scatterplots) derived from the Sysmex XN/XR series, with a focus on the WDF, WNR, and RET channels. Scatterplots form the foundation of differential leukocyte analysis and provide visual insight into cell populations and their abnormalities.
Scattergrams are a powerful tool for screening blood cells. The patterns are sensitive but not entirely specific and may therefore differ from the examples shown on these pages. Always interpret the plot in conjunction with morphology and other laboratory parameters.
Measurement
In the Sysmex XN, cells are analysed using flow cytometry. After the addition of specific reagents, cells are fixed, lysed, or stained depending on the channel. Individual cells then pass through a laser beam, where multiple physical properties are measured:
- Forward scatter (FSC) – related to cell size
- Side scatter (SSC) – related to internal complexity
- Side fluorescence (SFL) – related to nucleic acid content
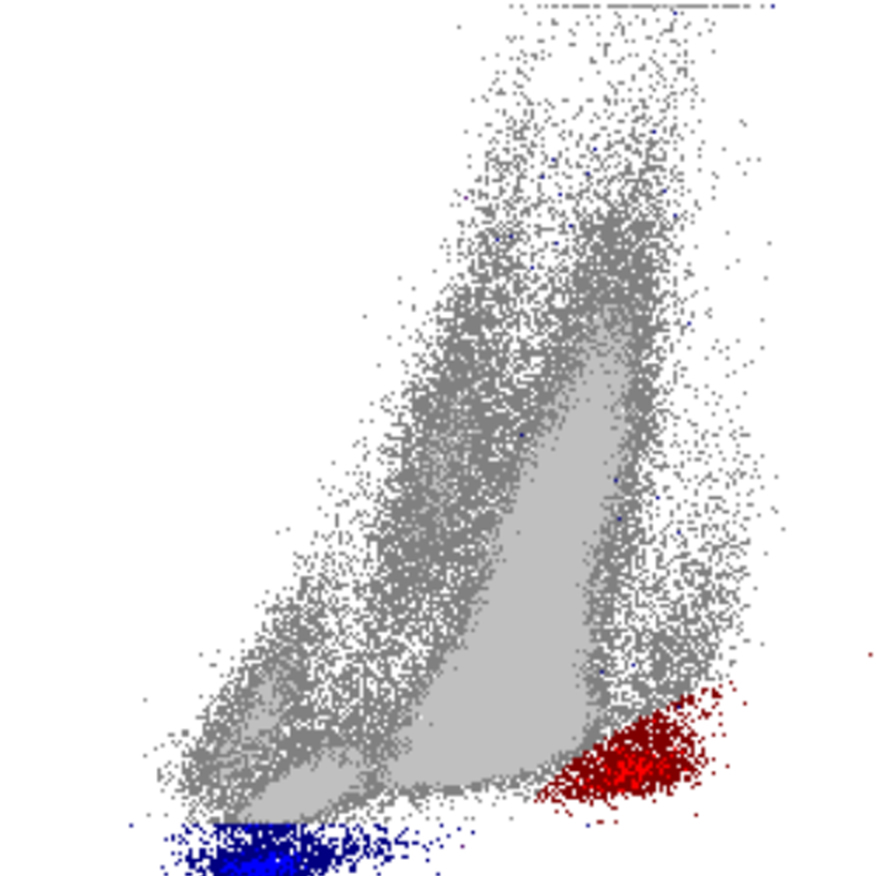
Forward Scatter
FSC is a measure of cell size: higher FSC values indicate larger cells, while lower values indicate smaller ones. Platelets show the lowest FSC, whereas monocytes, plasmacytoid lymphocytes, and some blasts are among the largest cells.

Low FSC
High FSC
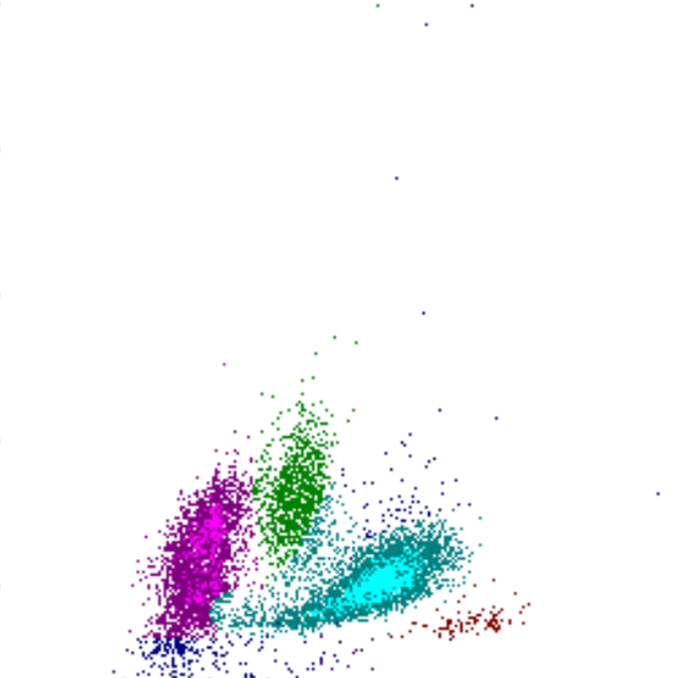
Side Scatter
Cellular complexity is primarily determined by the presence of intracellular structures such as granules. To a lesser extent, nuclear shape (lobulation) and the presence of vacuoles also contribute. In the Sysmex WDF channel, eosinophils show higher SSC than expected due to the reagent’s effect on their granulation.

Low SSC
High SSC
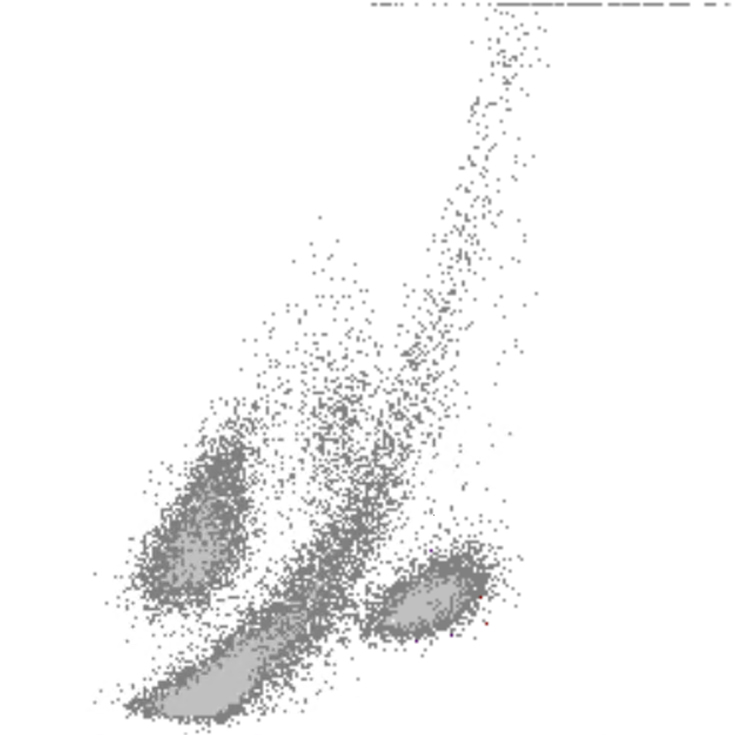
Side Fluorescence
The SFL signal reflects the nucleic acid content of cells. Cells with high SFL contain more RNA and/or DNA, which often indicates increased activity or proliferation. There is a limited correlation between SFL and FSC; although larger cells typically show higher SFL, exceptions exist such as blasts with relatively low SFL or activated lymphocytes with elevated SFL despite their smaller size.
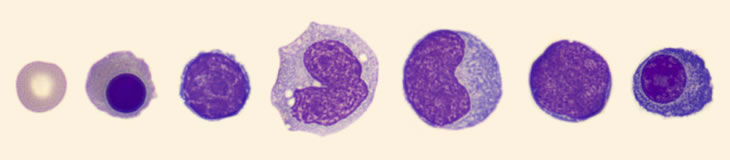
Low SFL
High SFL
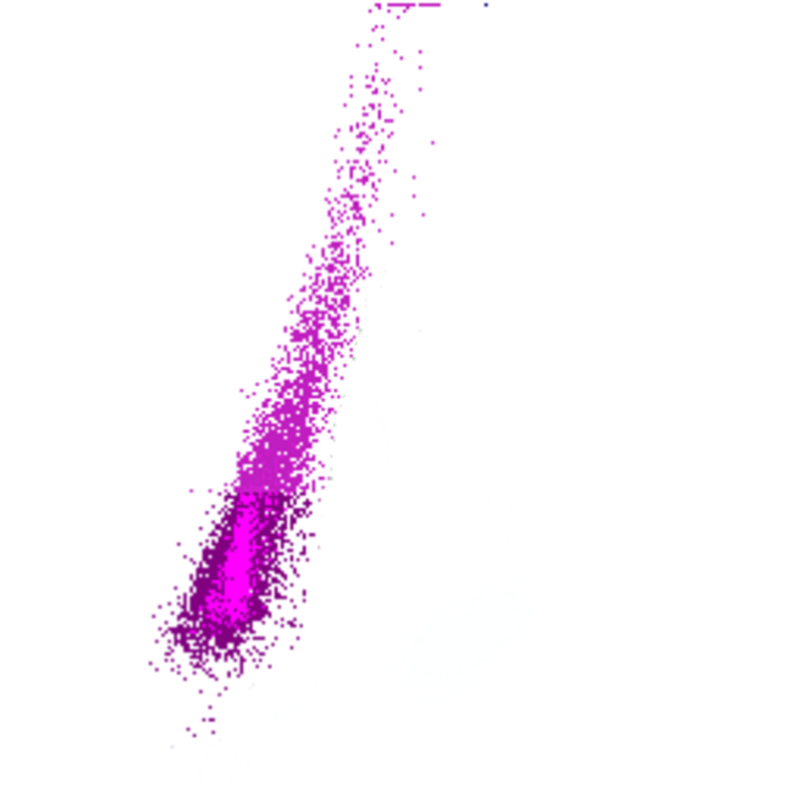
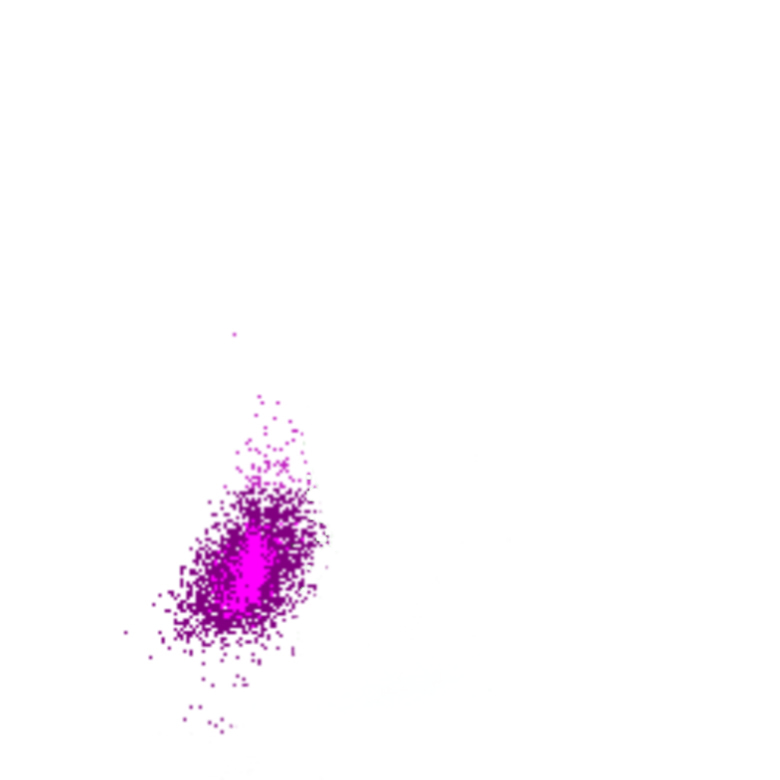
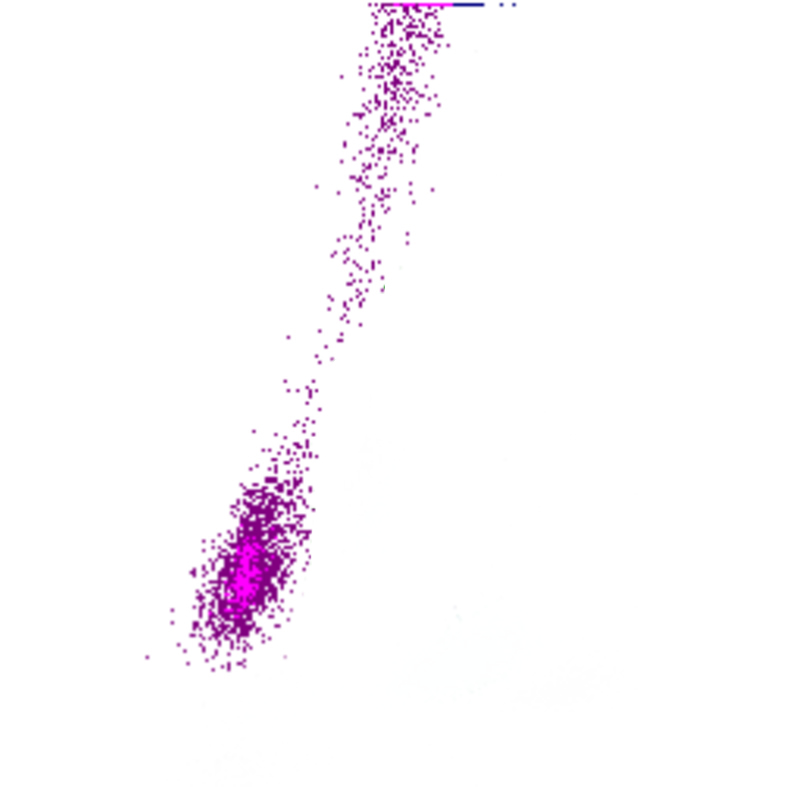
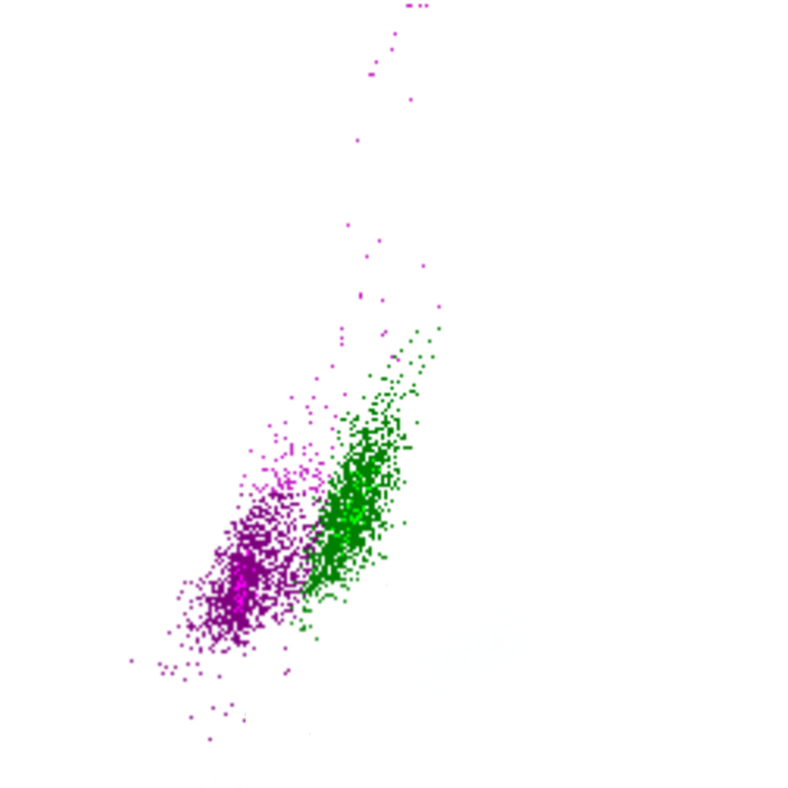
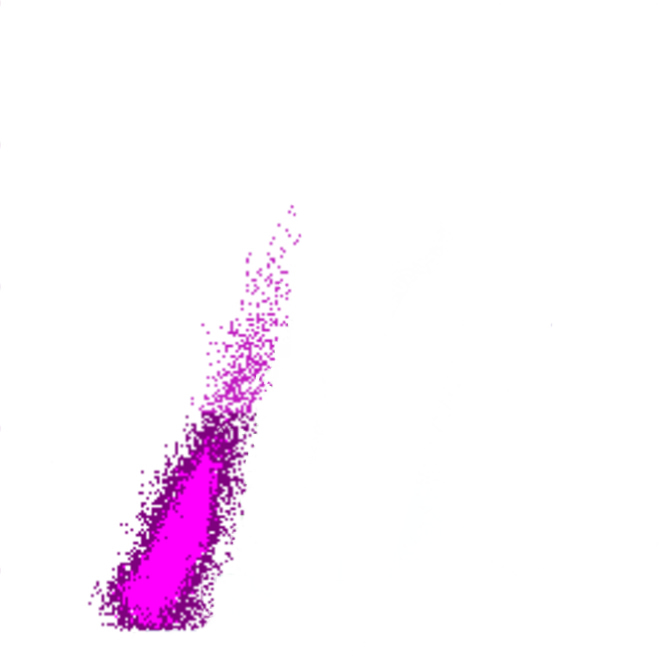
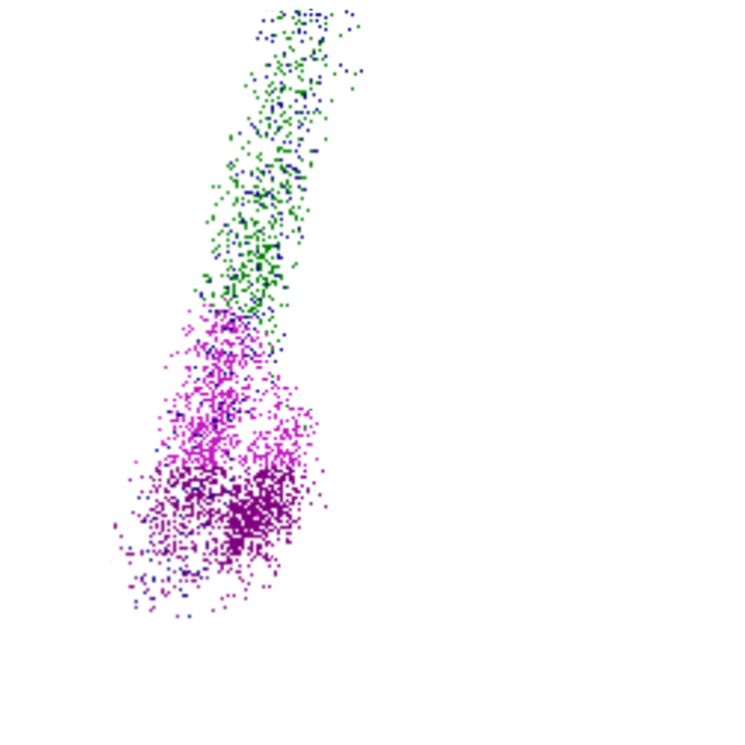
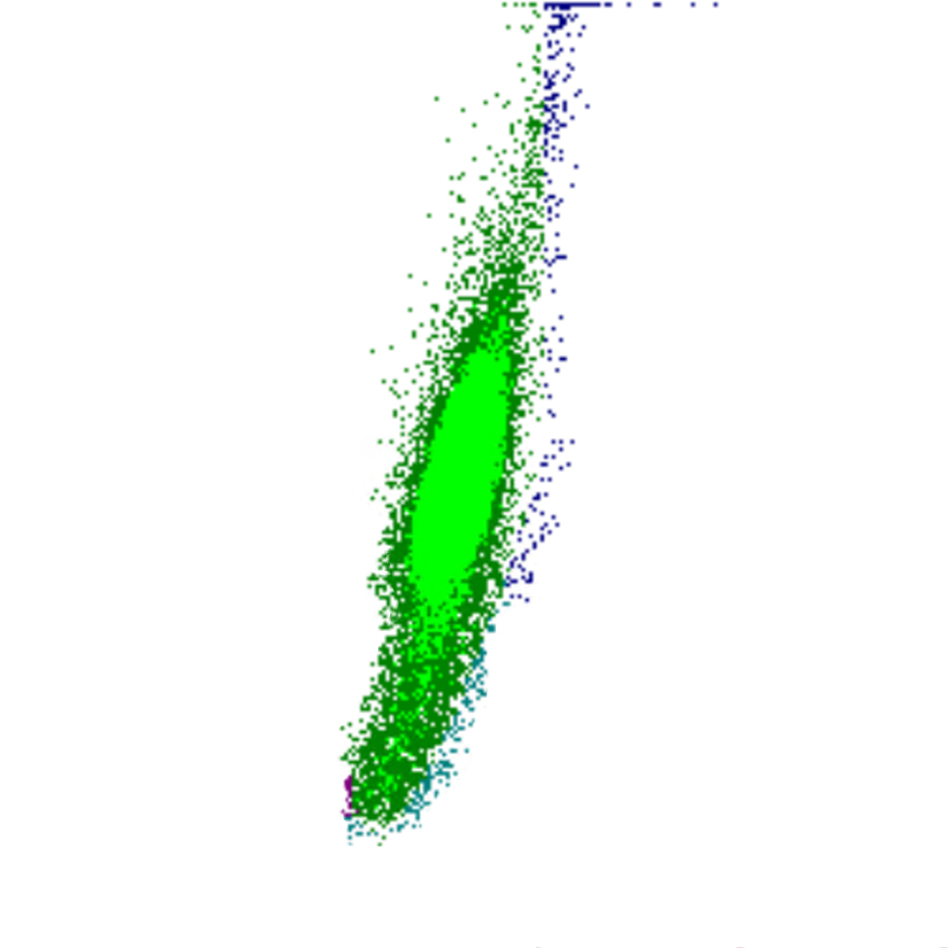
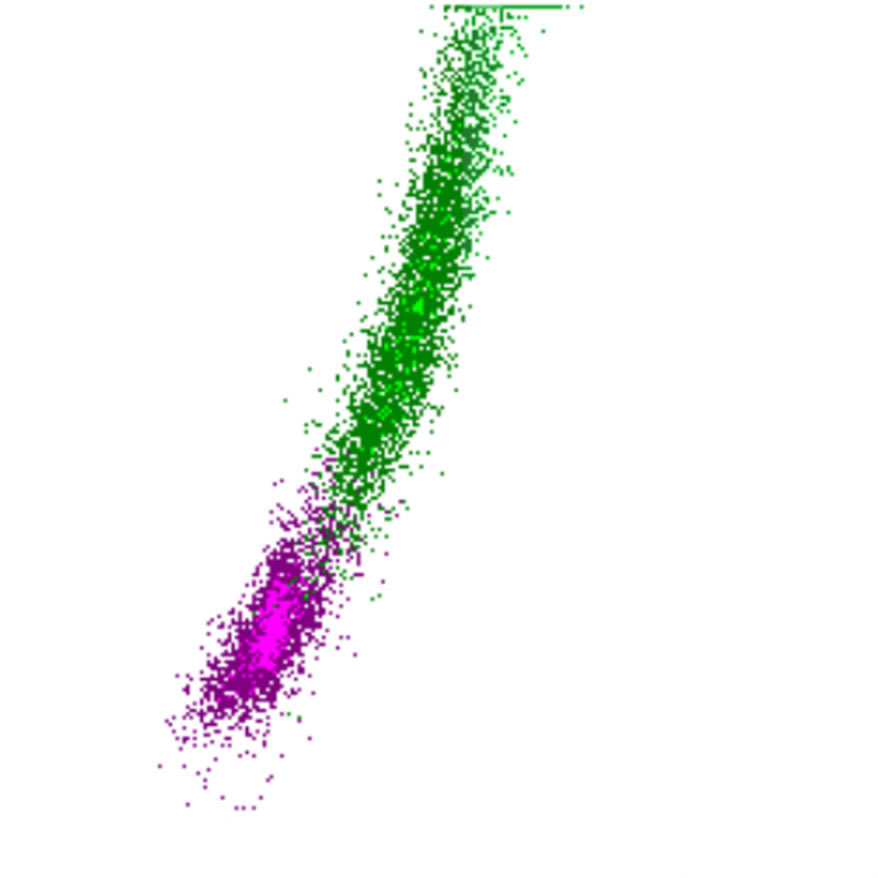
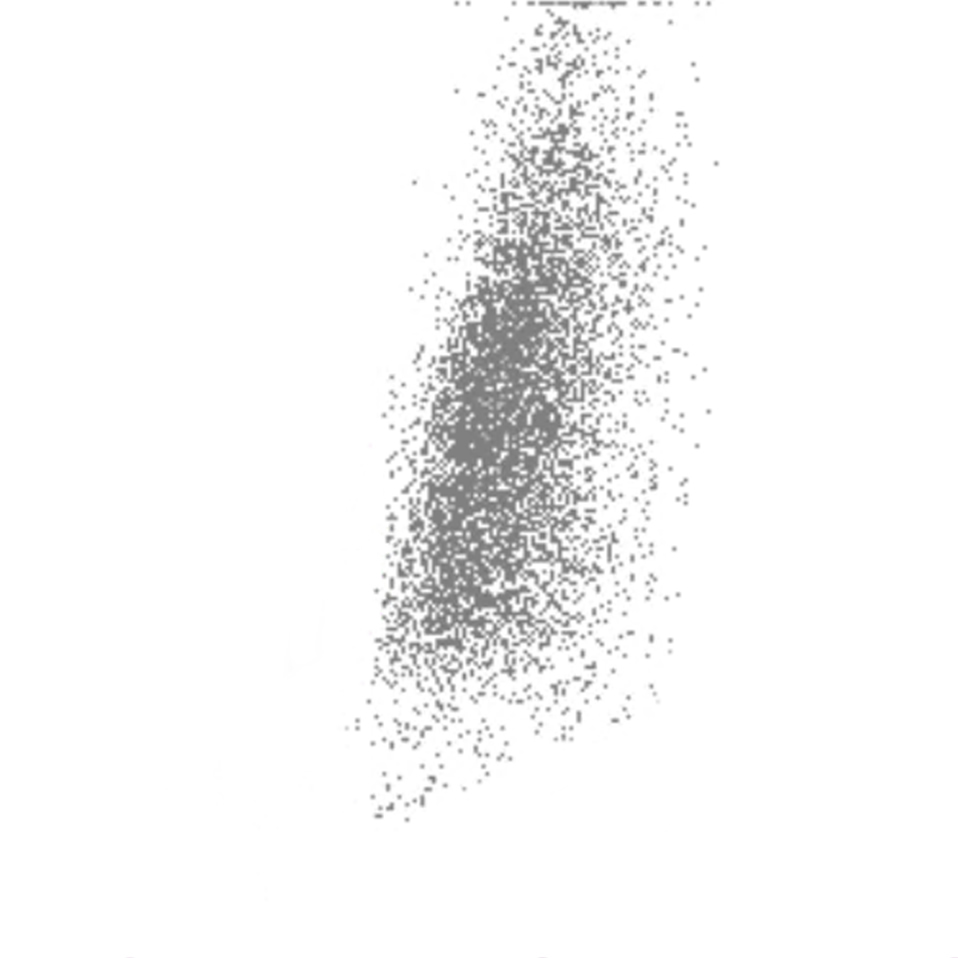
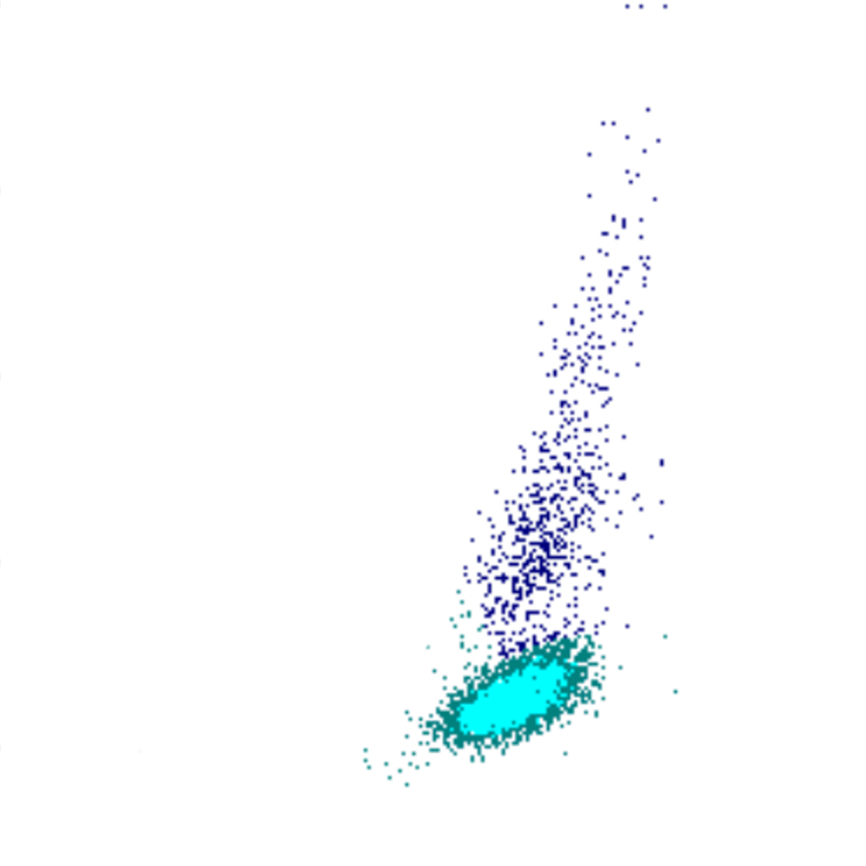
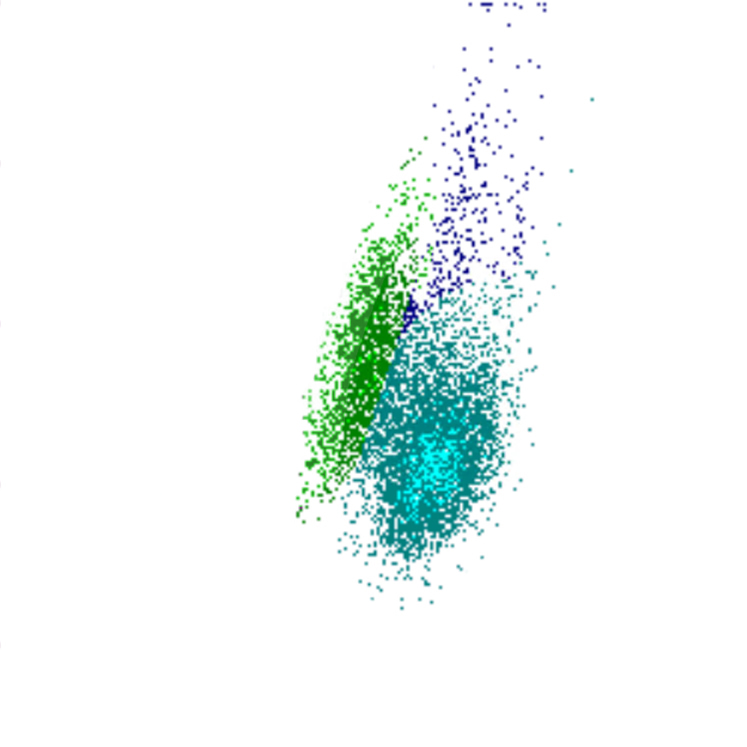
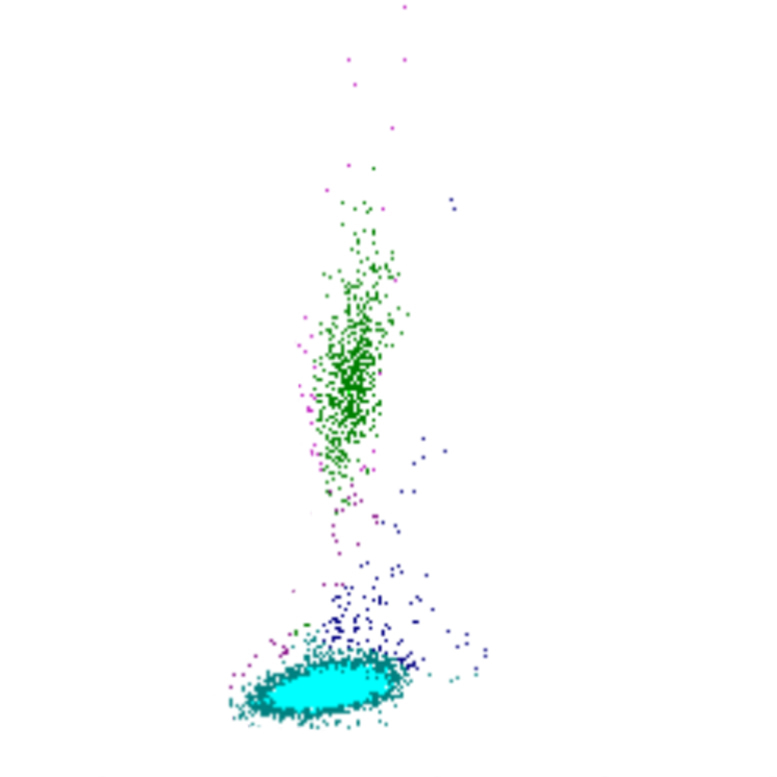
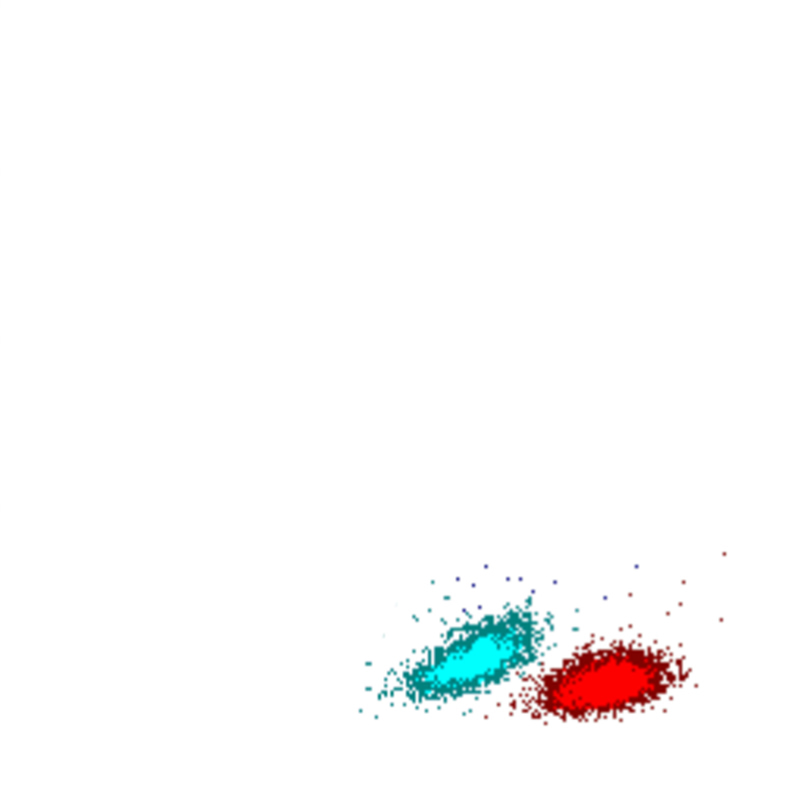
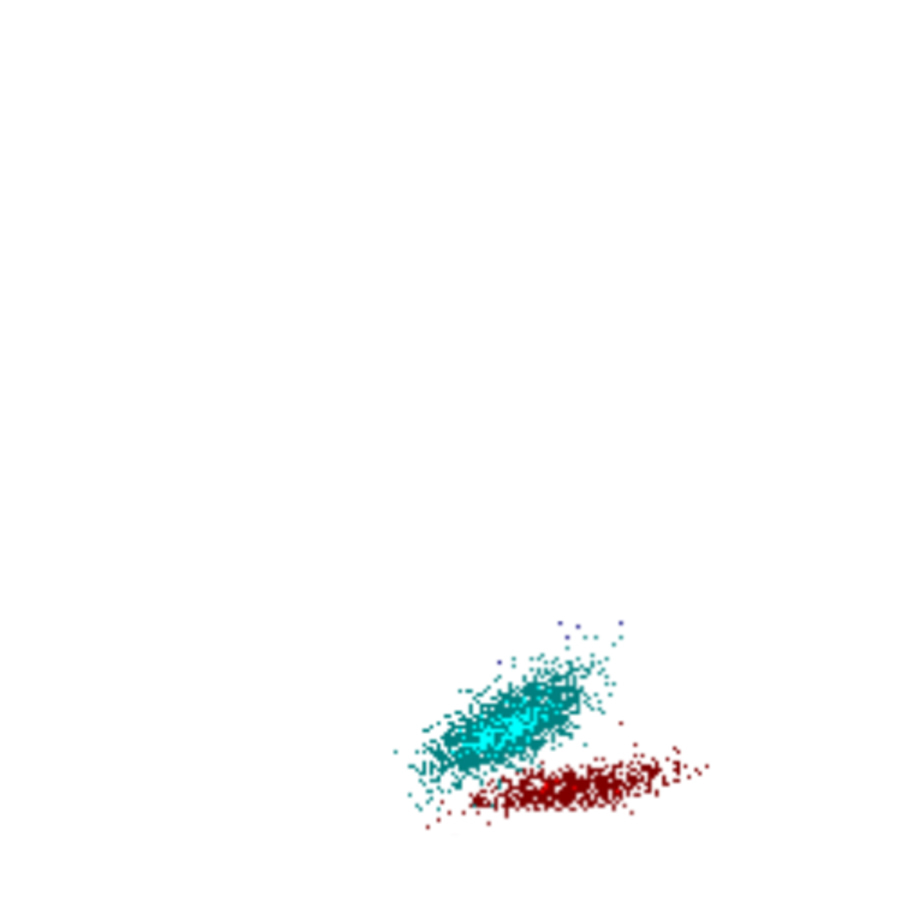
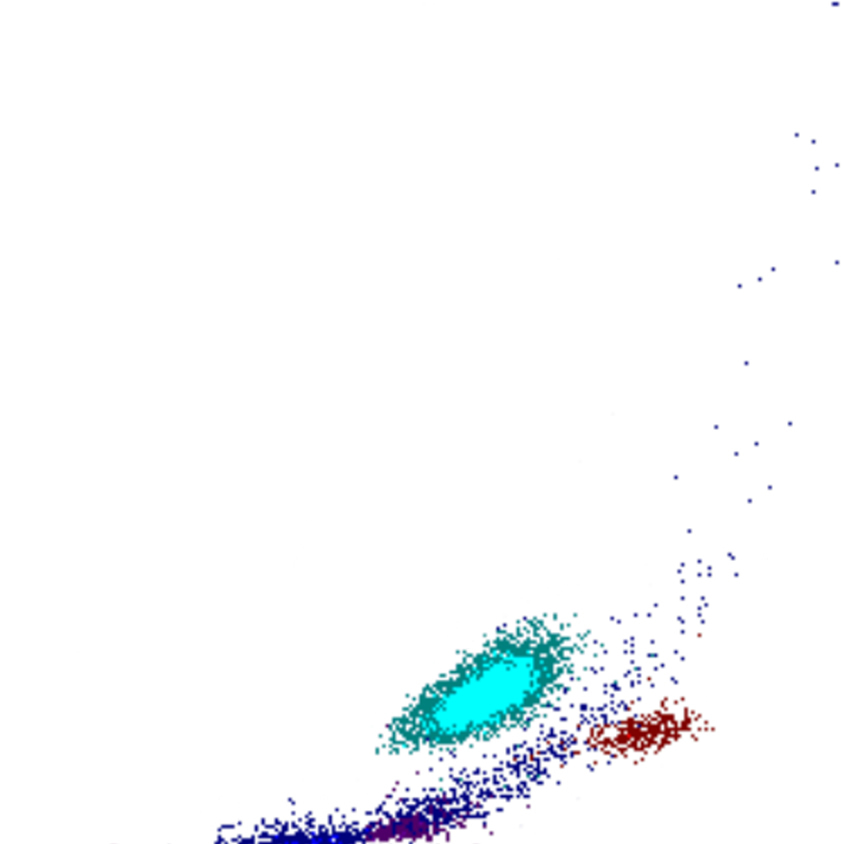
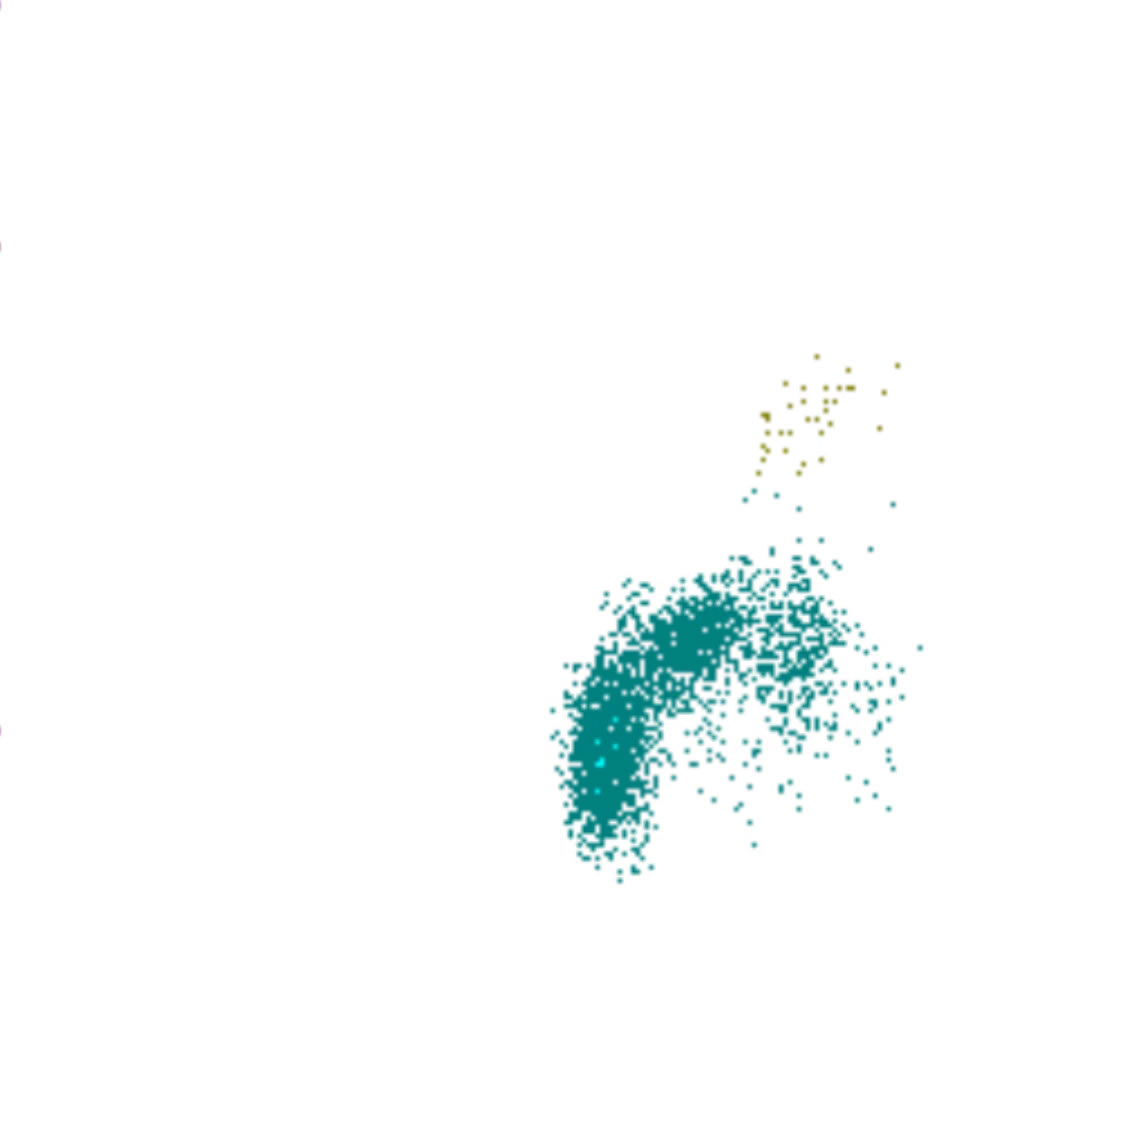
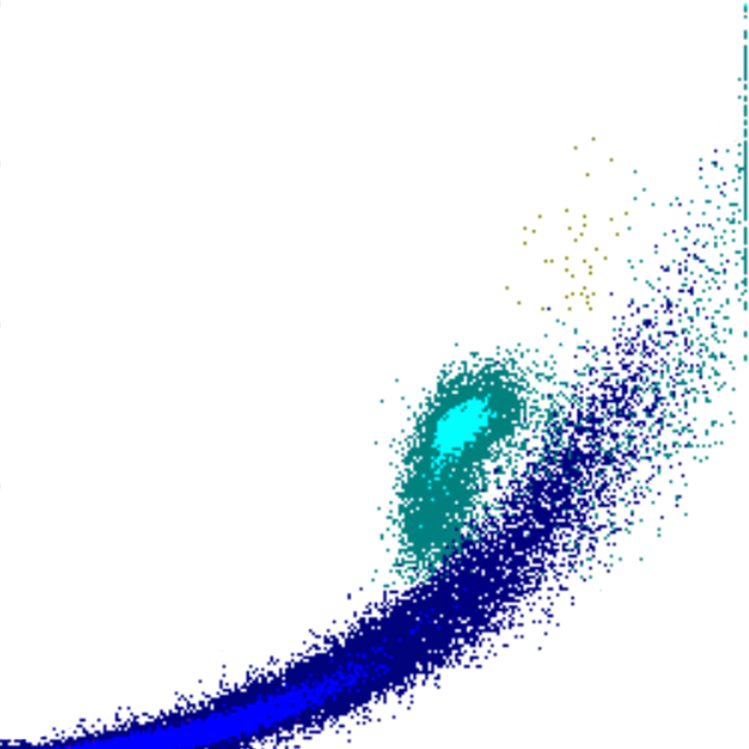
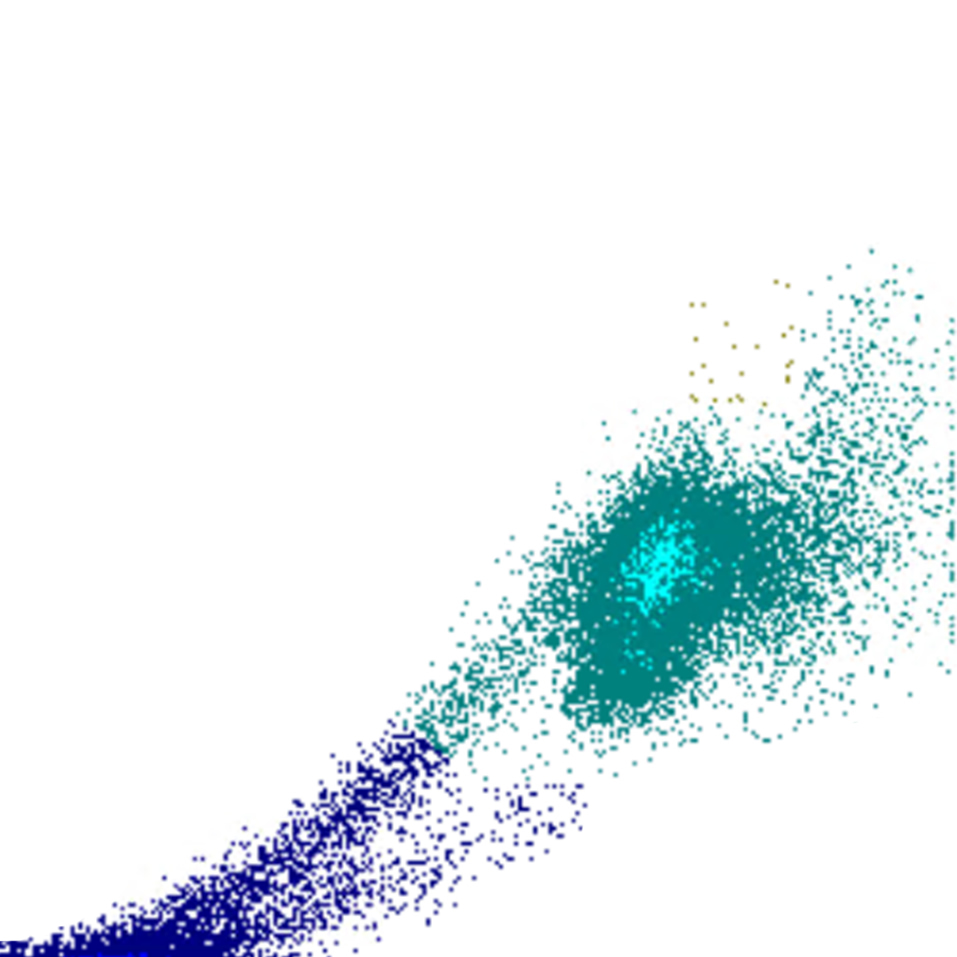
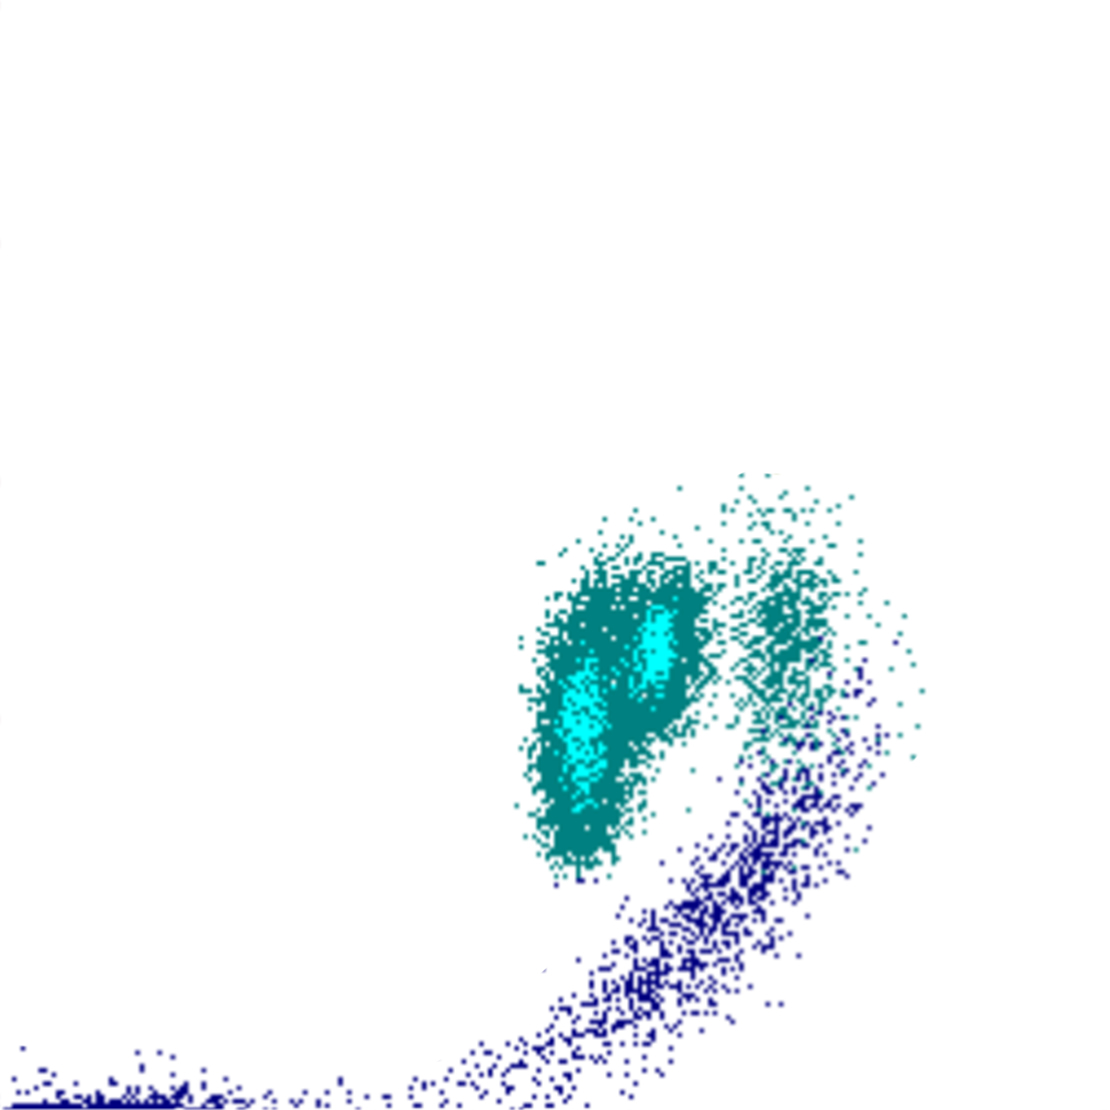
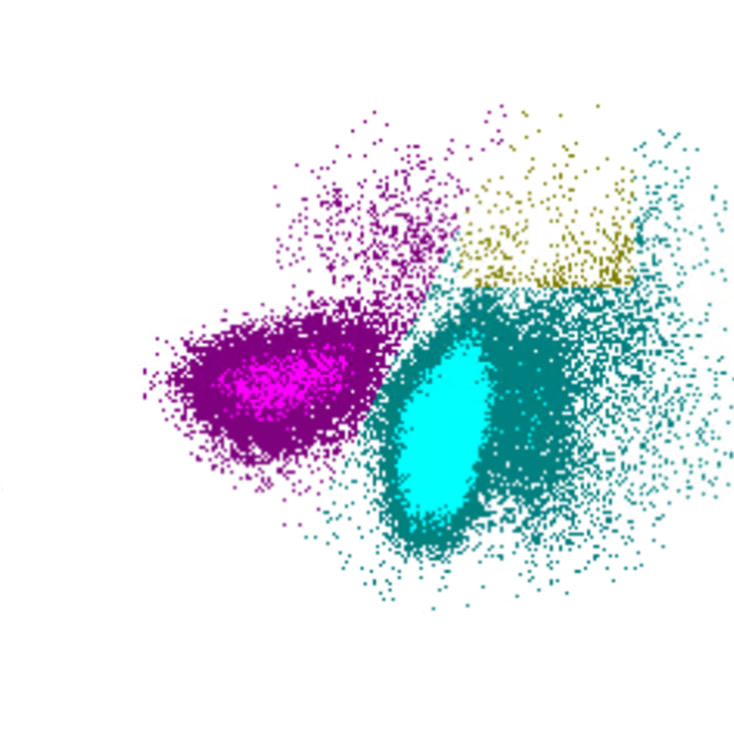
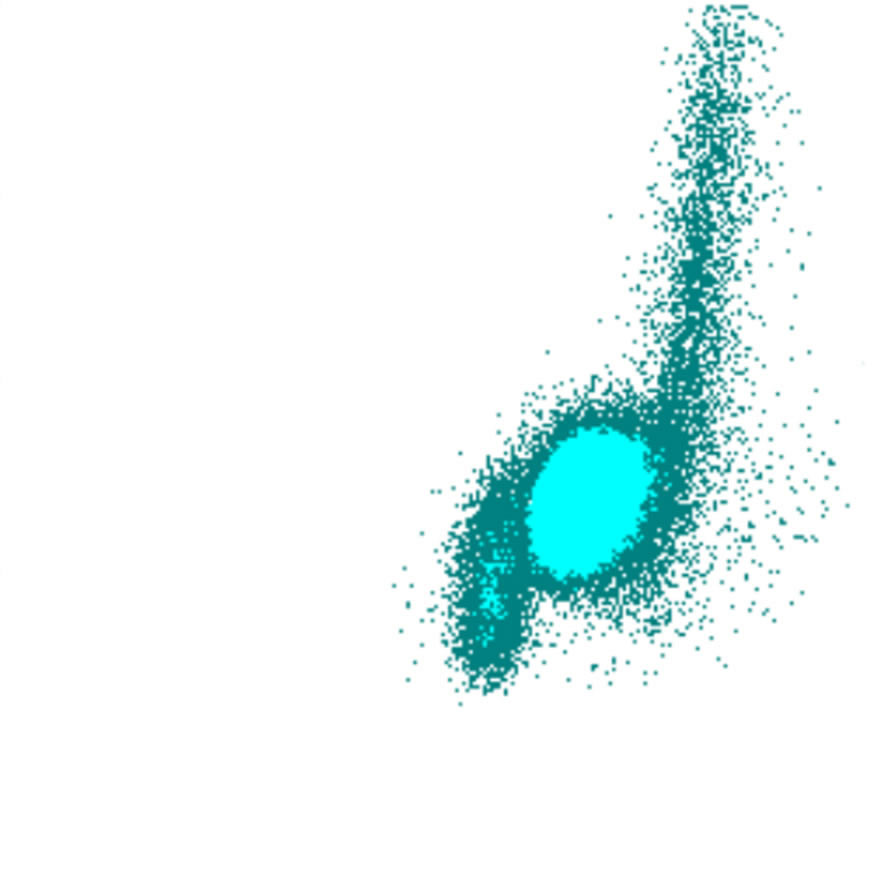
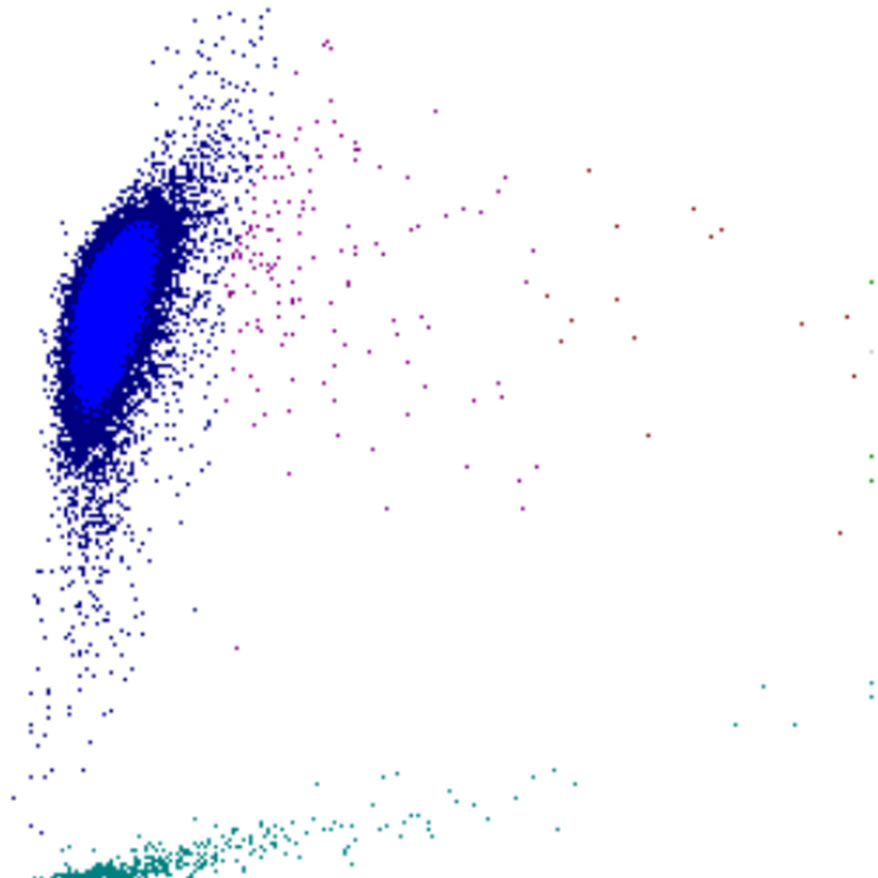
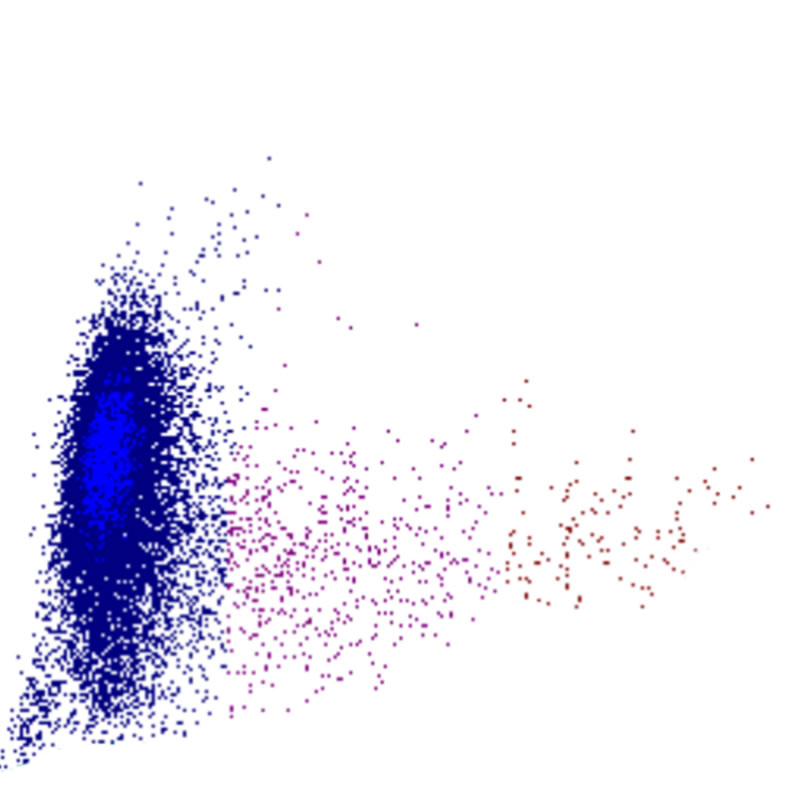
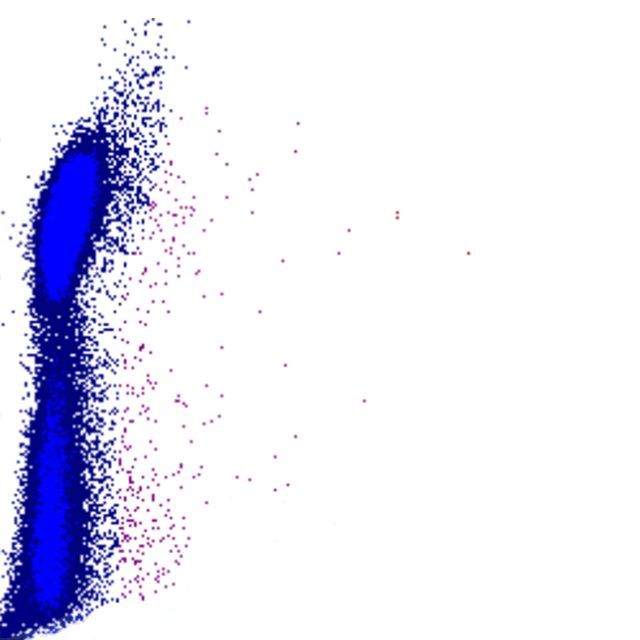
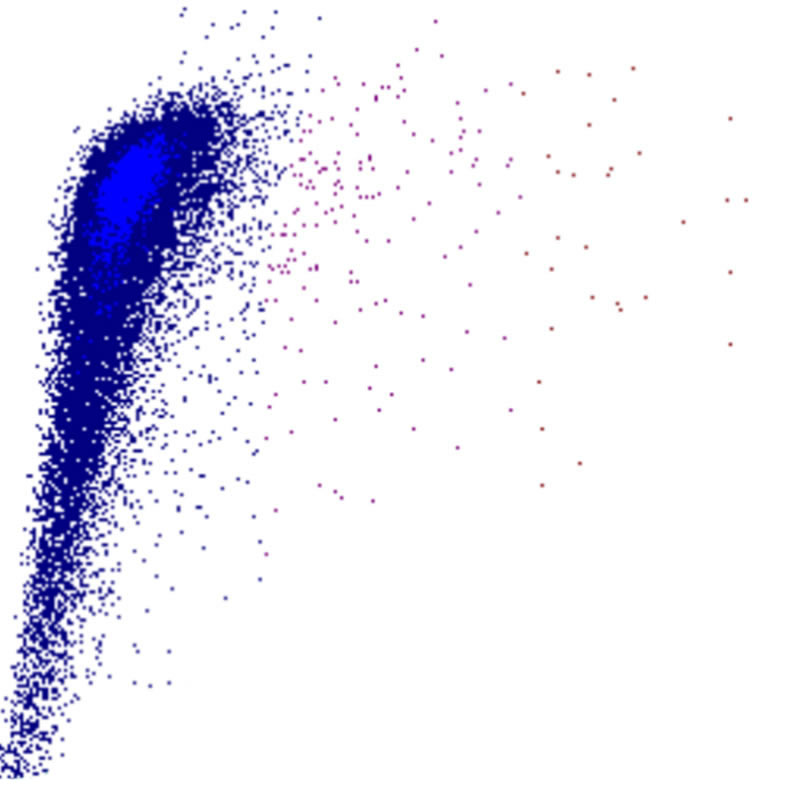
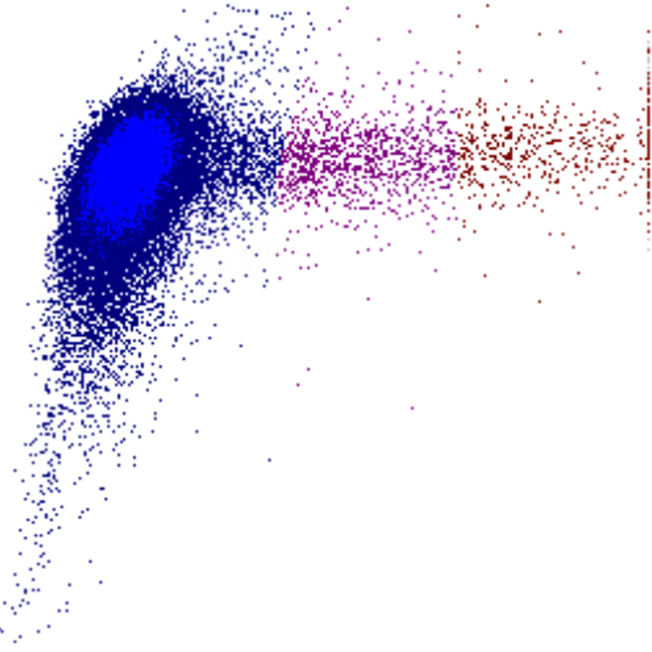
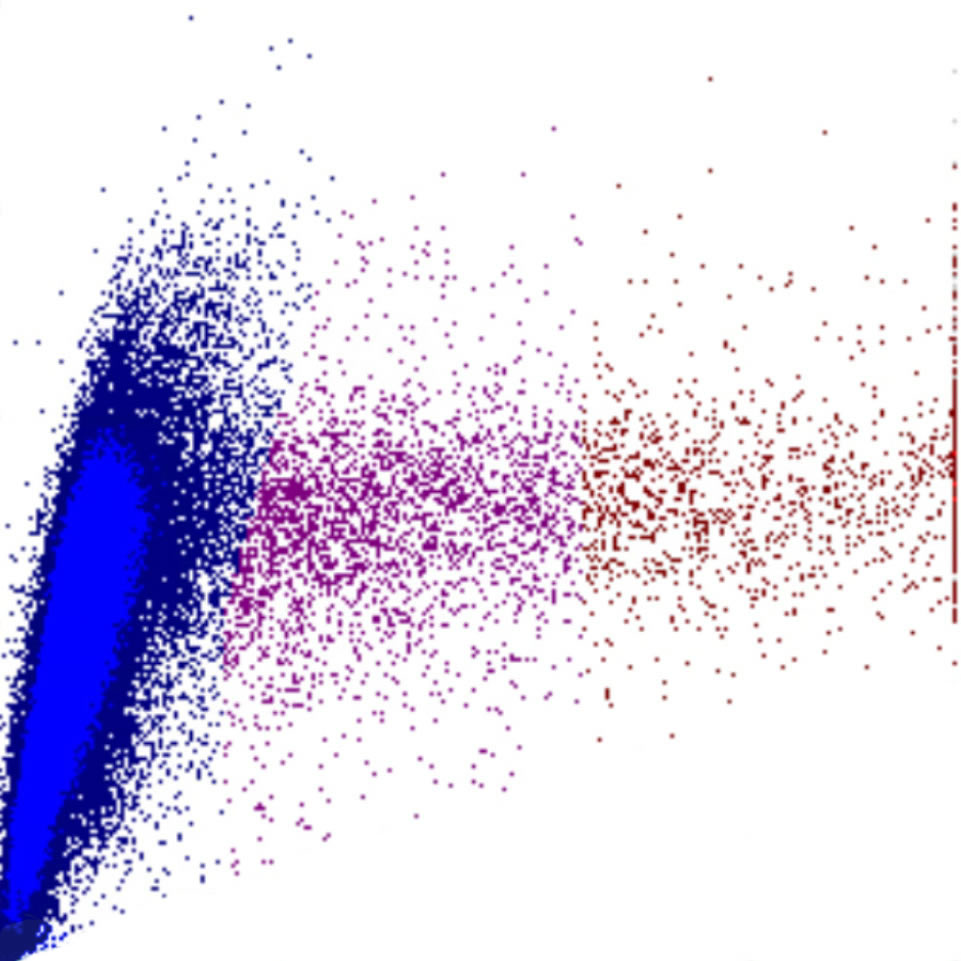
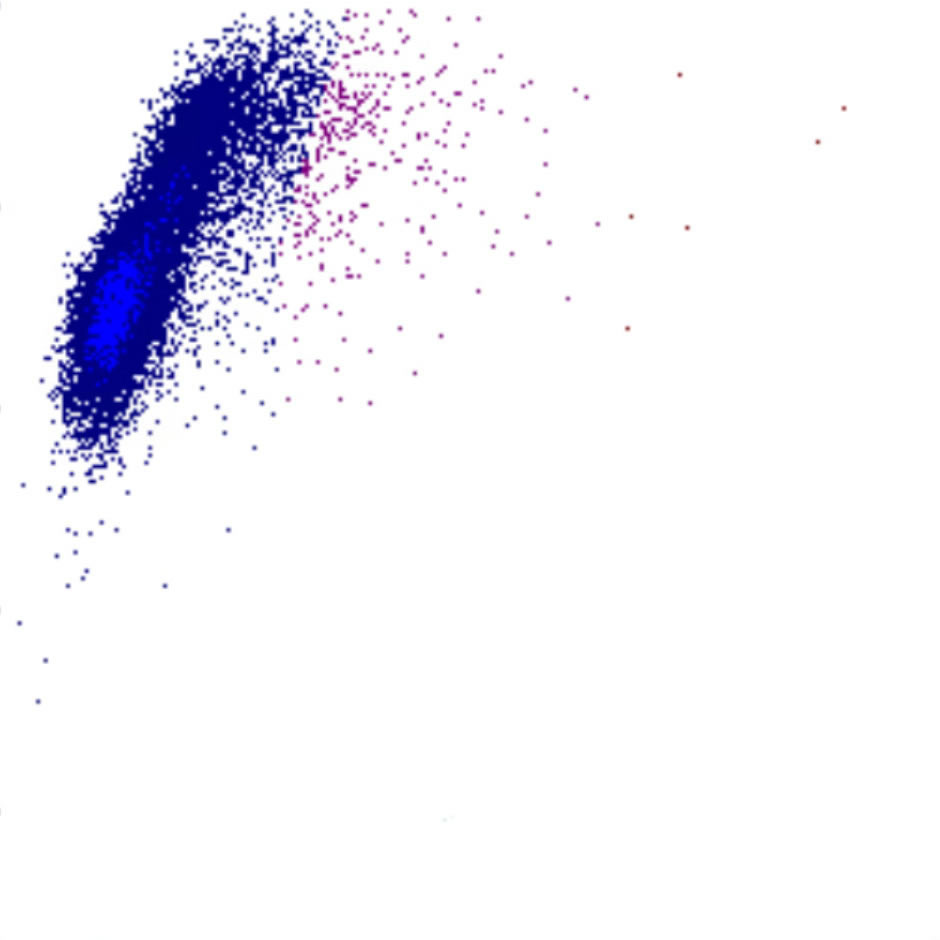
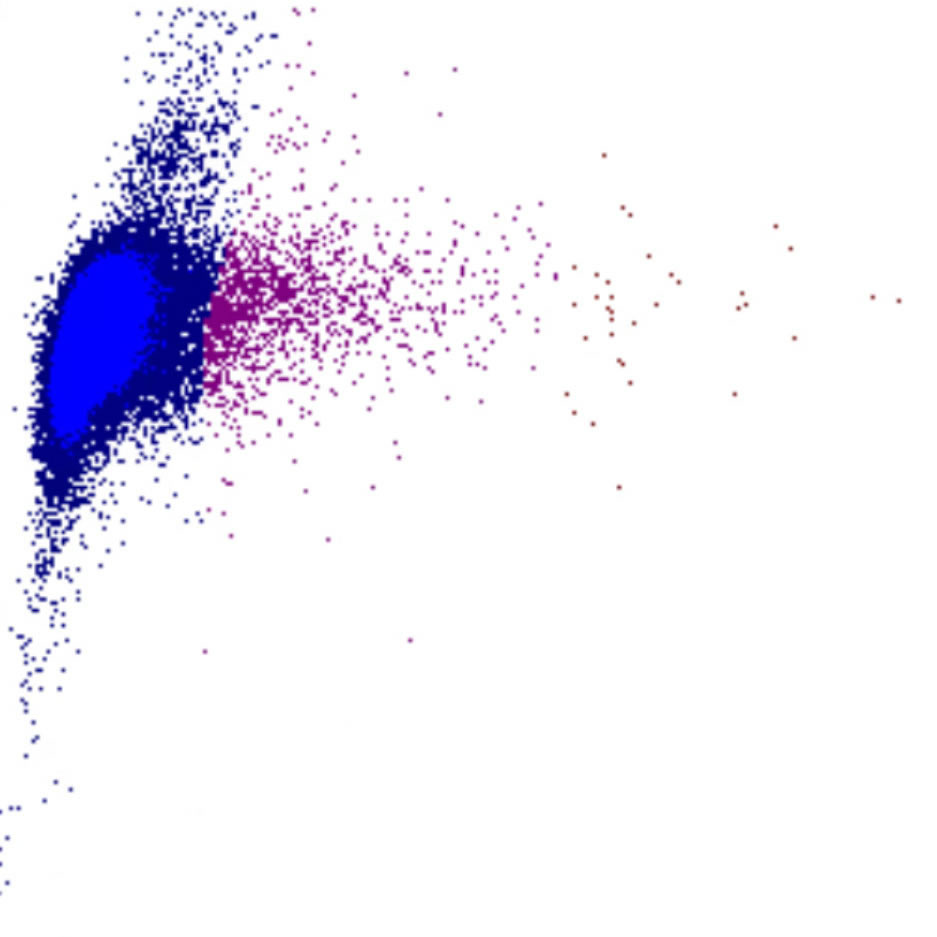
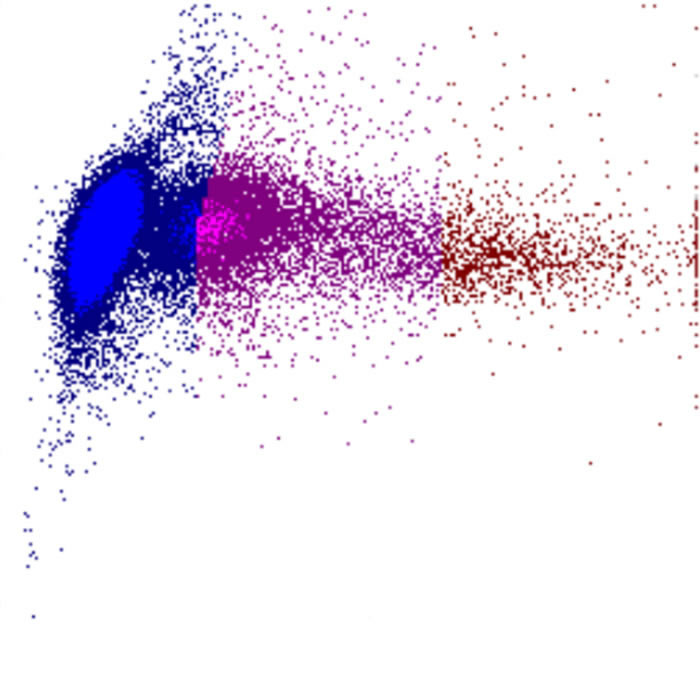
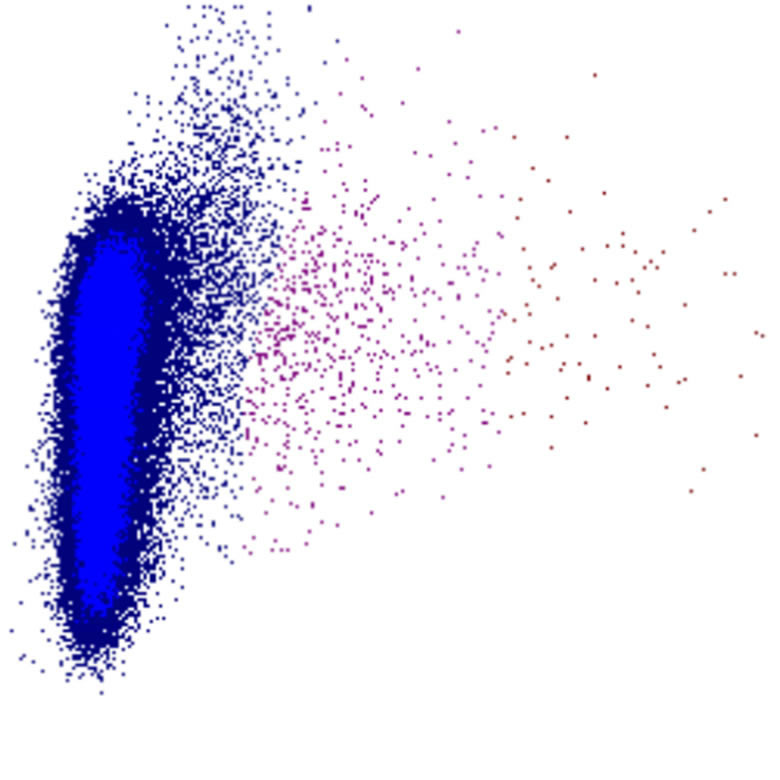
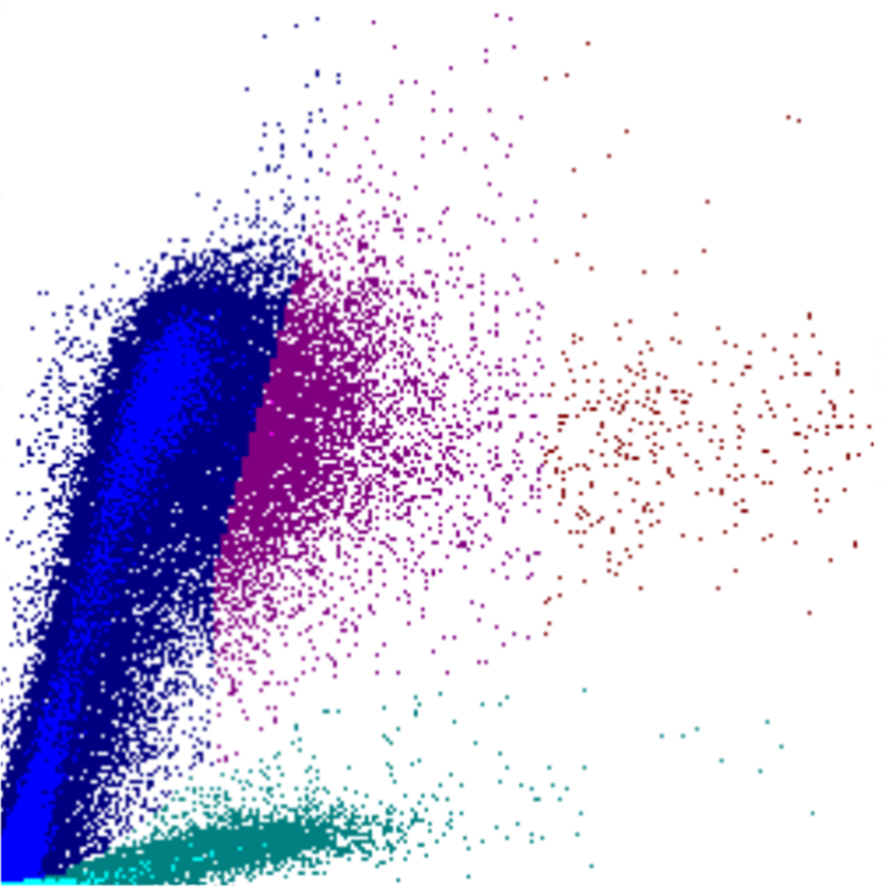
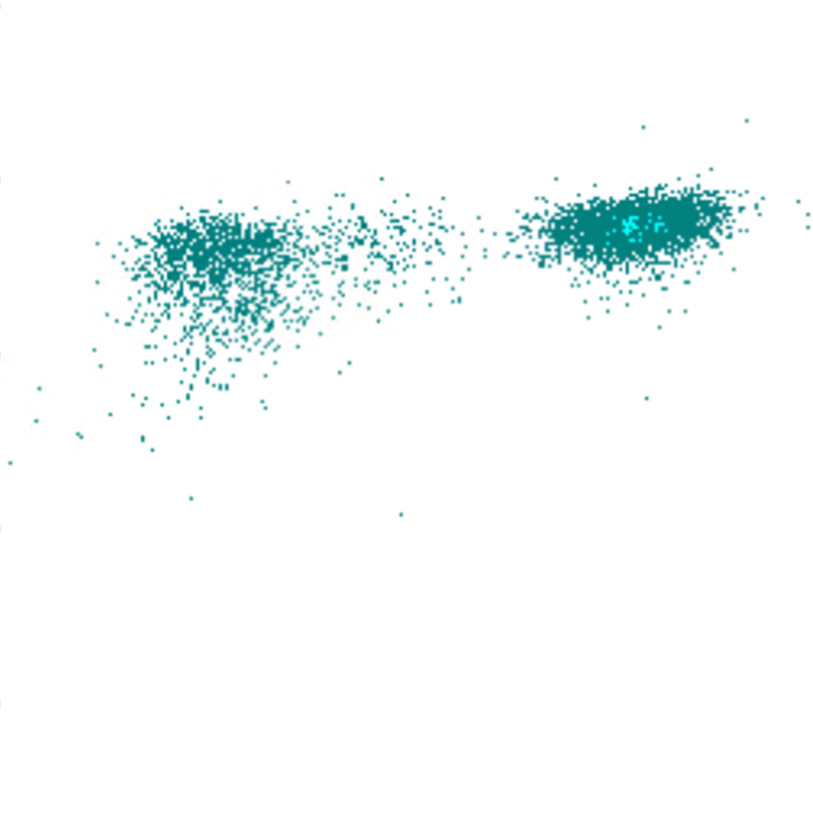
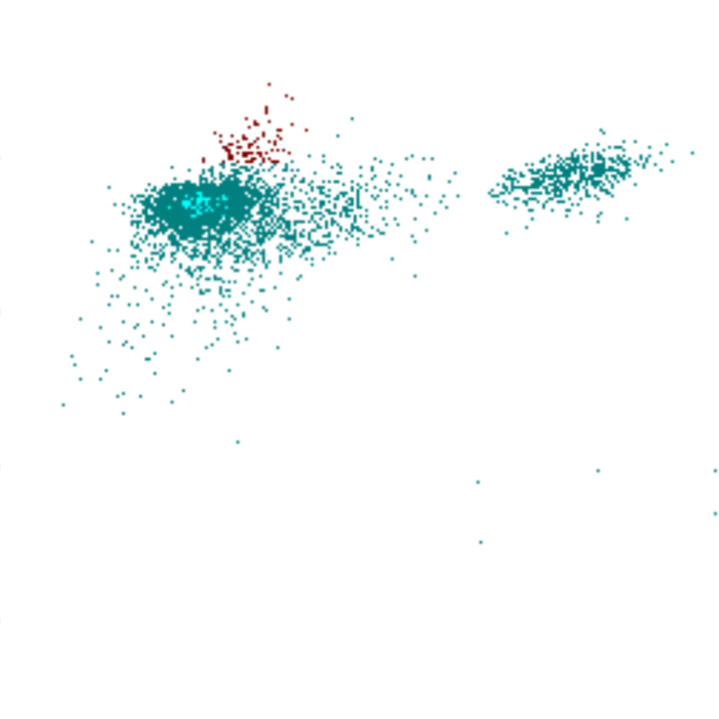
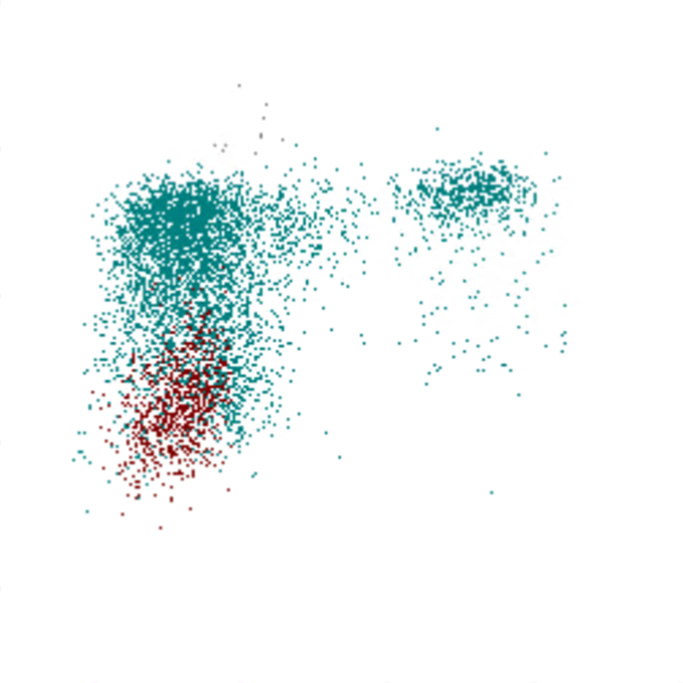
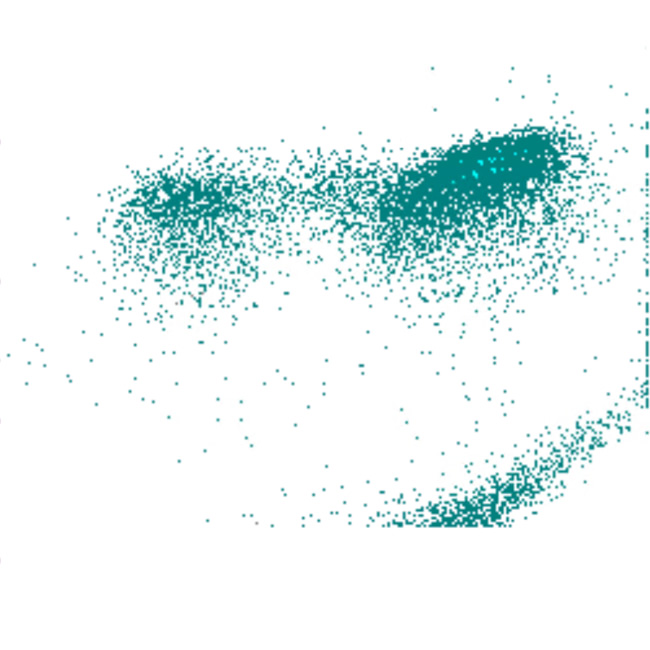
Density
The density of dots in a scatterplot reflects the number of cells with similar physical and fluorescence characteristics. A scatterplot therefore not only shows the presence of cell populations, but also their relative size and homogeneity.
- High dot density indicates a large and relatively homogeneous cell population
- Diffuse or scattered patterns may suggest heterogeneity, activation, or the presence of abnormal cells
- Shifts, broadening, or overlap between populations are often early indicators of abnormal morphology or rare cell types
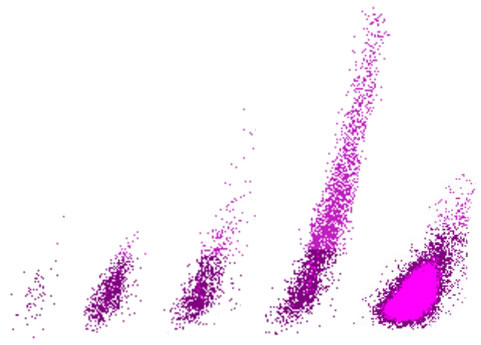
The image demonstrates, from left to right, a gradual increase in diffusion and density. It begins with a low-density population, followed by a population with average density and a normal diffuse pattern, then a slight increase in diffusion, subsequently marked (extreme) diffusion, and finally a population with very high density.


